Cube in ChatGPT
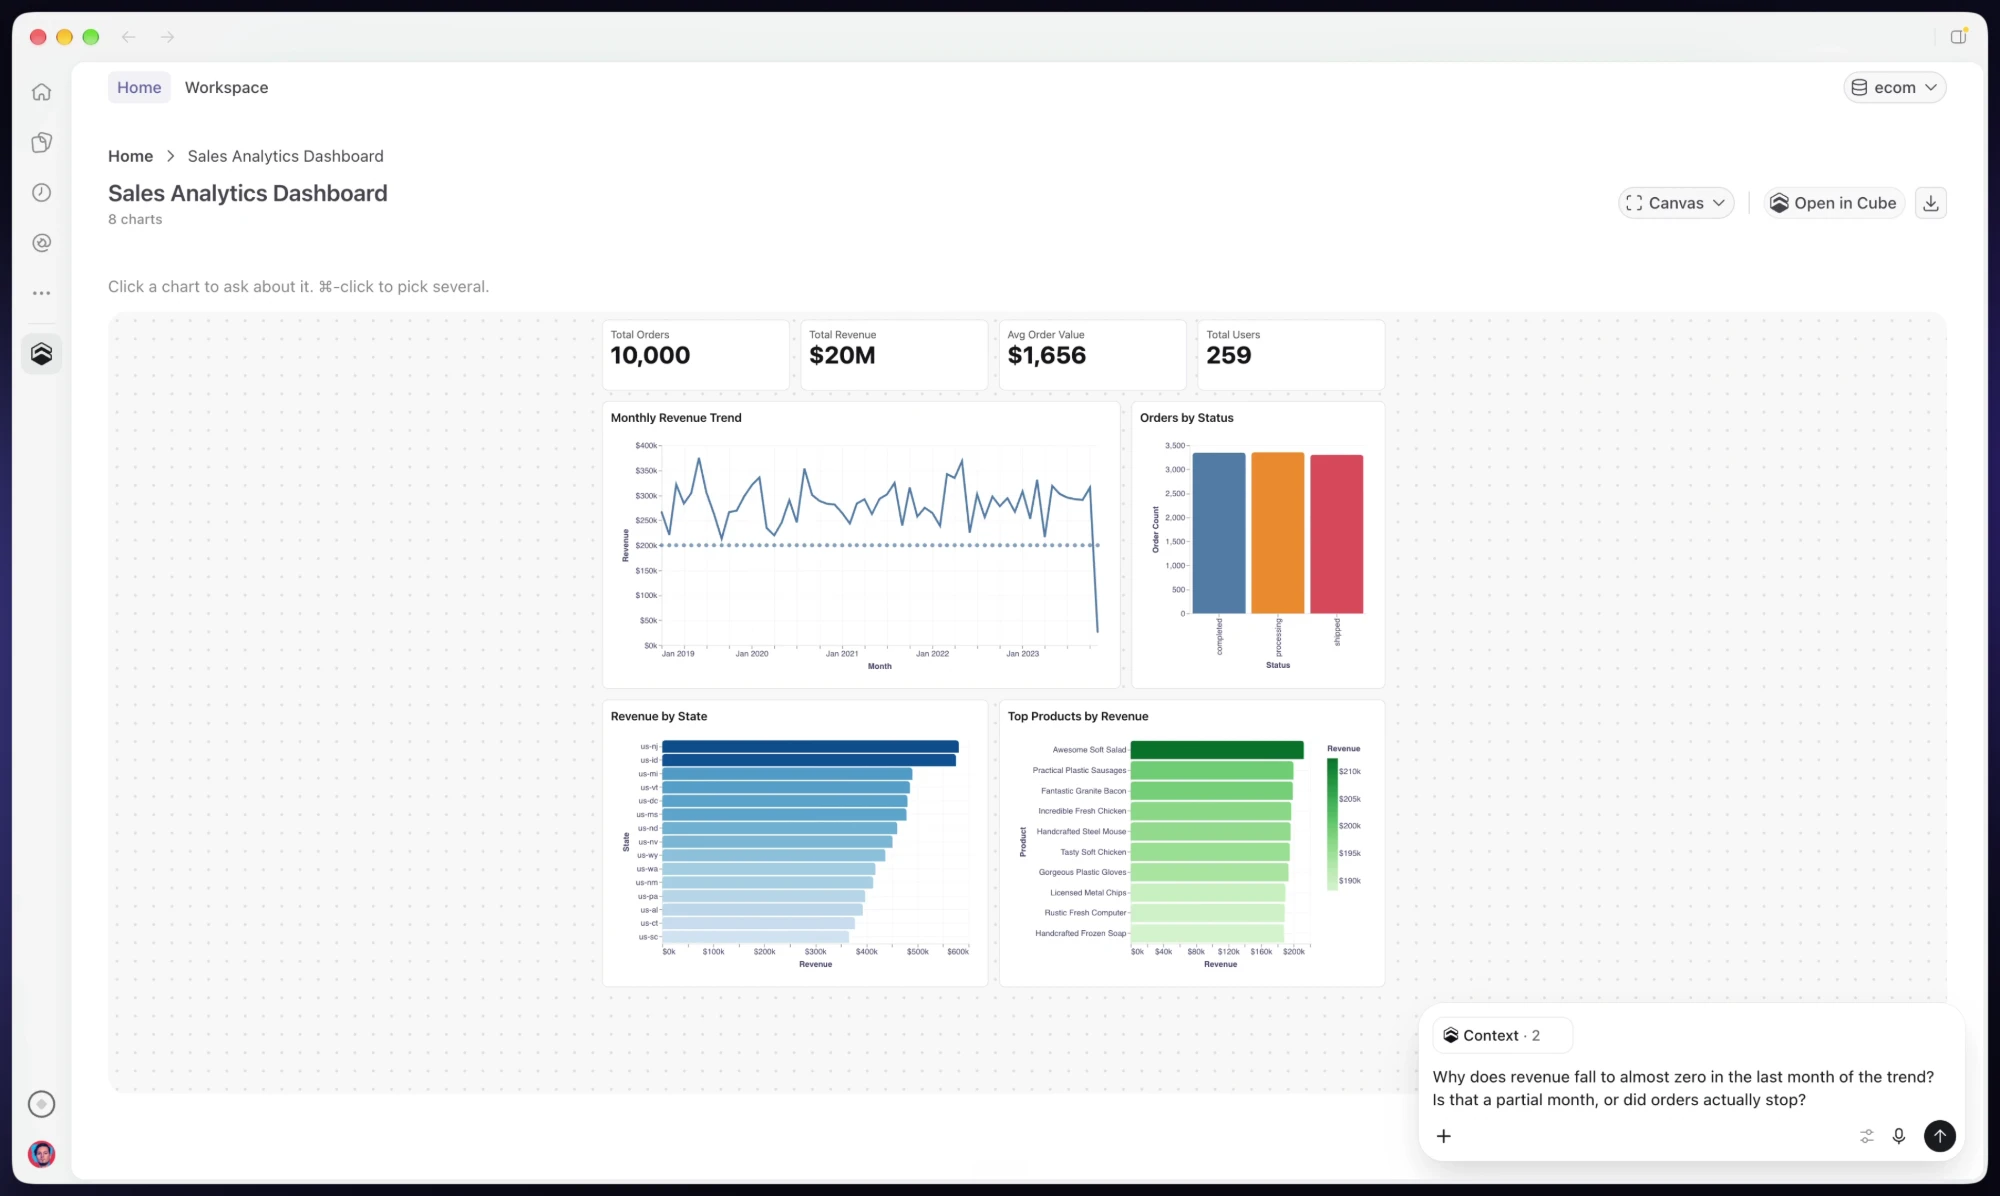
You can now use Cube right inside ChatGPT. Install the Cube plugin, sign in with your Cube account, and ask about your data in plain words. Cube answers with charts and dashboards built from your semantic layer, and every number comes from a measure in your data model, queried with your own Cube permissions.
Cube runs as a full app in the conversation. Browse and open your dashboards, workbooks, and explorations from the Workspace, and select charts to ask about exactly what's on screen. Ask for a dashboard and Cube builds one; ask for a change and it lands as a draft for you to check and publish. Cube Home suggests questions for each of your views, and any chart opens full screen or downloads as a PDF. Read more in the launch post.
Date filters
You can now pick a date filter's value in one popover with Presets, Relative, and Fixed tabs, in Workbooks and in Dashboard controls. Presets such as Last month or Past 30 days take one click, Relative builds ranges like "start of 3 months ago", and Fixed takes specific dates. The Up to now and From now options end or start a range at the current moment instead of at midnight, and the same popover picks a single moment for before and after filters.
A relative range reads back as one named chip, such as Past 5 weeks, with the dates in a tooltip — including the date filters that Analytics Chat writes.
Other improvements and fixes:
Workbooks
- You can now add a calculated field to the data model from the Data Pane, with the agent preparing the change for review
- The Save calculated field dialog now suggests a title and description from the expression
- Untitled workbooks now get a suggested name from their content
Dashboards
- You can now open a published Dashboard in full screen, and a
?fullscreen=truelink opens it that way on a TV - Clicking a point inside a chart's own cross-filter now offers Reset this filter and Narrow filter to this point
- Several Parent controls can now drive the same control
- Dashboard tabs and grids now get suggested titles from their tiles
- Each Dashboard version now gets a one-line summary of what changed
Visualization
- Clicking a legend entry now shows only that series, and Cmd/Ctrl+click shows or hides one
- Added Interval and Start at zero settings to chart axes
- Line and Area charts now space a numeric X axis by value, so gaps between values show
Integrations
- Added EDATE, DATEDIFF, and VARX.S support in DAX for Power BI
- Fixed Power BI DirectQuery matrices dropping values that differ only in case
Modeling
- Simple dbt metrics are now imported as Cube measures
- Fixed building in-database pre-aggregations on Oracle
- Fixed boolean dimensions and segments in ClickHouse pre-aggregations
- Cancelled queries and pre-aggregation builds now stop running in ClickHouse
API
- /v1/cubesql now supports
:nameparameters - The SQL API now pushes down APPROX_DISTINCT, TRIM, and SPLIT_PART, and DATEDIFF on DuckDB
- Query errors now name the OAuth account a user needs to connect
Workspace
- Comment mentions, replies, shares, and access requests now also arrive by email, with a switch for each in Preferences
- Viewers of a Dashboard or a folder can now request edit access
- Query History, dashboard comments, and list pages now work on phones
- Sheets deliveries are now called Report deliveries